Global share markets are fascinating reflections of human emotion and constantly offer us valuable lessons. For those of you who watch your portfolios closely and consume financial news, you may have noticed the ‘Flash Crash’ that occurred in early August. On the 5th August, the S&P 500 suffered the biggest daily fall in about two years and the tech-heavy Nasdaq 100 saw its worst start to a month since 2008. So, what happened – and what can we learn from it?
The backdrop to the global sell-off can be seen in the light of a surprisingly optimistic market. The US share market, buoyed by the excitement around artificial intelligence, was trading near record highs, even as some unease about the economics of AI was starting to emerge.
Following the Federal Reserve meeting at the end of July, equity and bond markets were increasingly confident that the long-anticipated cuts to US interest rates would begin in September. However, an unexpectedly weak US jobs report raised fears of a recession in the world’s largest economy, sending stock markets into a dramatic downturn.
The associated fall in global markets was severe. The US market retreated 3% and Japan’s Nikkei index was down 12%. Other Asian markets experienced a brutal sell-off and here in Australia, the index was down 3.7% on the day.
A small group of big tech stocks—like Microsoft, Apple, and NVIDIA—dragged down the US market after delivering average earnings. Their dip signaled that AI enthusiasm may have outpaced its near-term economic impact.
While market volatility can be unsettling, it’s important to remember that downturns and corrections are a normal part of investing—even during strong market periods. Since the start of the year, global sharemarkets have remained positive, with some rising as much as 15% over the past 12 months.
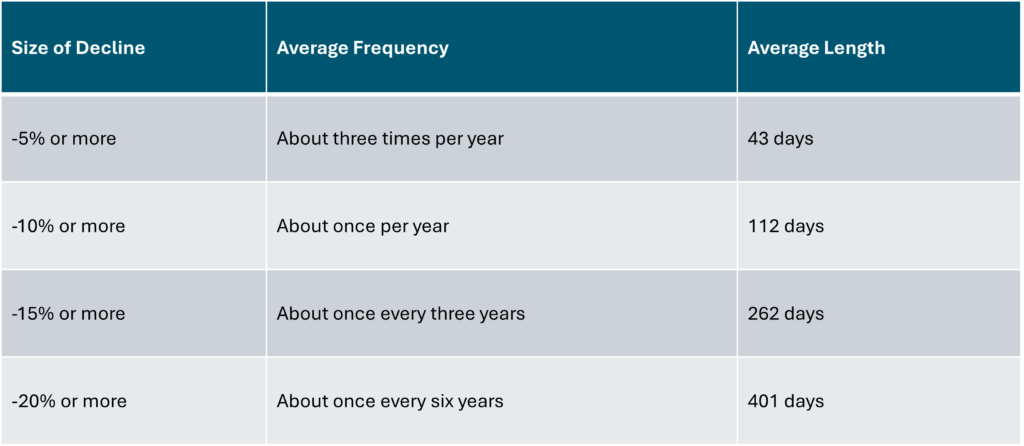
The chart below gives some additional context about how regularly you can expect to see the market fall, and how often (on average) it takes to recover those losses and move on to new market highs.
A few weeks down the track and with the benefit of hindsight, we can see how this episode has played out:
- The Australian sharemarket fell around 6%, and has almost recovered all losses;
- The S&P500 (broad USA market index) fell around 8.5% and has also almost recovered all losses;
- The Japanese Nikkei Index fell 19% and has recovered the losses; and
- The NASDAQ (technology focused index) fell 10% and has now gone on to new highs.
As investors, the lesson here is to stay disciplined and trust your well-diversified portfolio. No-one can accurately and consistently predict when these declines will occur, how deep they will be, or how quickly (or slowly) the market will recover.
In times like this, it is important to remember your long-term financial goals and stay true to your plan. Investing – as opposed to speculating – is all about capturing long-term investment returns and accepting that unpleasant, short-term volatility will occur regularly and is simply part of the journey.
Dr Steve Garth PhD, M.App.Fin., BSc., BA. is the Principal of Principia Investment Consultants and works with Capital Partners assisting with communications.
For nearly two decades, Steve played a key role in helping grow the Australian arm of a global asset manager. During his career, he managed Australian and global equity portfolios, managed the Asia Pacific trading team and for the last 10 years he managed the firm’s fixed interest strategies.
Steve received his PhD in Applied Mathematics from the Australian National University. He also holds a BSc in Mathematics and Physics, a BA with majors in History and Politics, a Master of Applied Finance.